


At FirstRate Data we were processing several thousand datasets per month and needed to develop a consistent and systematized approach to data testing and cleaning. Graphing the Data Prior to running any tests, it is worth noting that some errors will be unique to a dataset and will not be captured by automated tests. These errors will often be subtle and idiosyncratic and will probably only be observed by a human. For example: 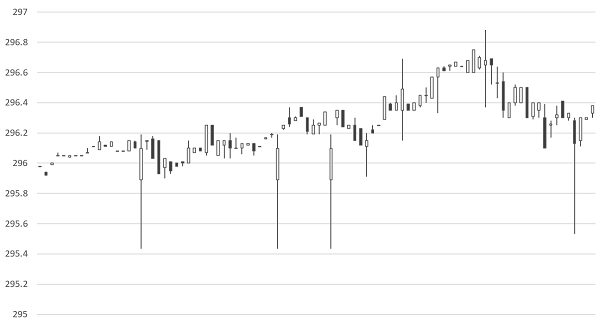 In the above chart of AAPLâs share price, three identical bars can clearly be observed and appear out of sequence with the series. Despite being visually obvious, this error passed many tests since the range of the bars is not inconsistent with the range of other bars in the sequence. In general, the types of errors that can best be visually observed are multiple out-of-sequence bars, bars with duplicate or truncated data (eg bars ending in the same round number such as multiple opening prices at 295.00), and finally noise which interrupts the wave-link patterns typically formed by price movements and gives a randomized look to the charted data. Obviously it is impractical to manually review the chart of each dataset when processing a large number of datasets but a visual inspection can be a useful sample test. Types of Errors Although there are numerous types of errors that can occur in intraday datasets, the three most common account for the vast amount of errors, namely : gaps, outliers, duplicates. We recommend testing the errors in this sequence (ie gaps, then outliers and finally duplicates) as this is the order of severity - for example, gaps in the series cannot be fixed and may render the dataset unusable and so proceeding with additional tests and cleaning protocols is a waste of resources. Before proceeding to review the automated tests it is worth considering the merits of using multiple datasets for the same series to test against each other to detect errors. A second dataset for the same series is very useful for filling gaps or correcting errors, however, it is of limited use in testing for errors. The reality of the market for financial data is that the data is that vendors typically source data from an upstream data vendor, and so two datasets purchased from different vendors may actually have the same source and so contain the same errors making testing comparisons pointless. Gaps Intraday bars can naturally have gaps in a sequence if the data vendor elects not to include bars with zero volumes (ie when there has been no trading). This is usually done to limit the file sizes and may be necessary if out-of-hours trades are included, in which case there would be long periods when no trades occur. In such a circumstance, it is difficult to determine whether the gap is a naturally occurring gap when no trading took place or if it is due to an error in the series. The first, and simplest, test is to check the number of bars per day to check for missing days. Surprisingly, we found that the most common gaps are those which span several days (or even weeks) and render the dataset almost useless. Gaps within the day are the most challenging to test for. This is because they occur randomly and it can be difficult to distinguish genuine gaps in trading from gaps due to errors in the series. For the intraday gap tests, we run two tests - first a correlation test between volume and the number of bars, and second a test of the intraday distribution of bars. For running basic stats tests, Excel is a poor choice as it has limited regression functionality, we would recommend a simple dedicated stats application such as Minitab. Firstly, the volume and number of bars test. Volume is normally strongly correlated with the number of trades in a day and so the number of bars should be higher on days with high volume, thus a low number of bars on a high volume day is indicative of missing bars. To test this we need to run a correlation on daily volume and bar count, then compare the actual number of bars with the predicted number of bars and test the significance of the difference. The below is a sample of output from running this test on SSRM (SSR Mining Inc) stock in early January 2020: 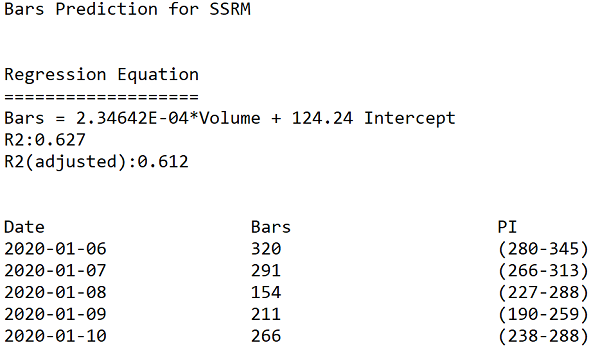 Firstly, note the R2 of 62% which is strong enough for forecasting from financial data (typically bar/volume R2 range from 45-70) The bars column lists the number of bars in the dataset for each day. The final column - PI (Prediction Interval) is the expected range of expected bar numbers. Note that the 2020-01-08 day has a bar count far outside the predicted range and so would almost certainly contain missing bars. Outliers Testing for outliers requires the most judgment as it can be very difficult to definitively determine whether a recorded datapoint is incorrect or just a price spike. To test for erroneous high and low prices simultaneously, it is convenient to use the bar range (ie high - low) and test this single datapoint for errors. There are numerous tests to flag outliers, the one we favor is creating a moving distribution of 200 bars and checking the number of standard deviations the bar range is from the distribution mean (this obviously assumes a normal distribution os setting the standard deviation flag higher than 3 is a shortcut to the fat tailed distribution). The key point to note on using this method is that the bar being tested must have an equal number of bars before and after in the distribution. Thus a bar at â2020-05-01 10:15:000â would be tested against a 200 bar distribution of 100 bars prior and 100 bars after the bar timestamp. Tests using only the distributions of bars prior to the bar being tested will cause false flags for bars at the start of a volatility spike when the bar is anomalous to the preceding bars but not to the later bars. Setting the number of standard deviations as the error threshold is the judgemental part of this test. In part, this threshold relates to the use of the data and the requirement to preserve correct outliers. Certain types of analysis such as using resistance/support levels need to be aggressive in excluding false bars whereas movement indicators can be more permissive. In general a threshold of 4 standard deviations is an acceptable compromise. Duplicate Bars Duplicate bars are very straightforward to test for using either a scripting language or a stats package to flag bars with the same timestamp. Correcting the Data The final step is correcting the data. For gaps, unless a second reference dataset is available there is no correction possible so a determination needs to be made on how severe the gap is. For outliers, it needs to be established how corrupt the bar is. Some overly aggressive correction routines discard all data (ie OHLCV) in outlier bars and replace with interpolated values between its two nearest bars. However, it is common for only a single datapoint in the bar to be incorrect and so only the high, low, close or open needs to be adjusted. In practise the vast majority of the errors are in either the high or low (this is because the intraday bar range is built up from multiple sampled ticks only one of which needs to have a false value). We therefore need to determine whether the high or low is an error which is usually straightforward. There are several ways to correct this value, we favor taking the average of the range for the closest two bars and then adding this to the low (if the high is incorrect) or vice-versa if the low is incorrect. This, therefore, preserves the rest of the data in the bar and makes the assumption that the range is consistent with close by bars. For duplicate bars, if the bars are identical the duplicates can simply be removed. If they are not consistent then a determination needs to be made on which bar to keep. Usually, there is an obvious error (such as an outlier) in the duplicates and so can be removed. If the datapoints in the bars are similar then compiling them into a single using the means for each datapoint is appropriate. Finally As a final step, the data can be graphed again - this is because some of the correcting procedures may themselves cause errors and anomalous patterns can be observed. Once these steps are complete the data is ready for analysis. comments powered by Disqus |

|
|
|
|
