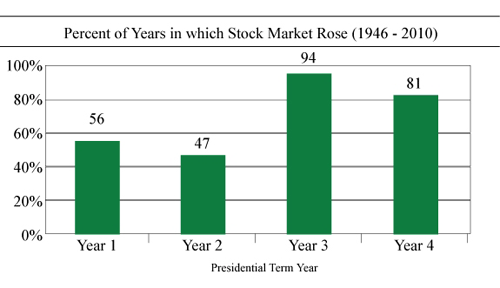
Let’s consider an example. If you invested $100,000 in an index fund that tracks the Dow Jones Industrial Average (DJIA), it will have a dynamic market value. When the market falls 10 percent, your portfolio will be worth $90,000. If the stock market booms for a long time, your account could be worth $300,000, only to come crashing down to about $200,000 when the market corrects itself. At this point, there will be a rush to sell and this will see the market fall further with all the uncertainty. Therefore, a buy and hold strategy is easy to stick with when the market is performing well and not so when it does not do well. The performance of the S&P 500 When looking at the movement of the S&P 500 from April 30, 1945 through April 21, 2006, it shows a 7.1 percent average return in the November to April stretch and a 1.5 percent average gain from May to October. Furthermore, the November to April months outperformed the period from May to October the majority of the time. The data shows that the S&P 500 performs the worst in September and the market hits a low in October only to rebound in November. This is one of the reasons behind the surge in the months from November to April. However, there is also increased cash infusion. The month of January is when pension funds start investing a lot of their money and in April, many people put a lot of money in their IRAs. This is also a time when analysts look ahead five quarters which is not the case in September or October when analysts focus on just one or two quarters. Even when observing the S&P 500 sectors, it shows a similar seasonal pattern. Seasonal Investing aims to reduce losses As can be seen from the above examples, there is seasonality in the stock market. Risk can be reduced a lot by using a seasonal investing strategy. There will be more profits earned when the losses due to poor stock market performance are reduced. A Wall Street adage goes “Sell in May, and then walk away,” which signifies how stock movements have performed better from November to April when compared to the May to October period. It is all about risk reduction Stock market exposure is greatly reduced in seasonal investing and as the above example illustrates, it will lead to better returns than the highly touted Buy and Hold Strategy. An interesting example is that of the U.S. presidential election scenario. The year prior to the election is the time to buy stocks and so an investor would do so once every four years. In the other years, the funds would be placed in a money market account. There was a study done for this 4-Year Cycle Strategy (4-YCS). This 4-YCS had a total return of 2,406 percent!  This goes to show how an effective seasonal investing strategy can multiply returns astronomically without taking on additional risk. Seasonal trends to take note of Past performance is no guarantee of future results, but investors should consider these seasonal trends. January Effect This is the period when investors re-evaluate their portfolios after the winter holiday break. A new year sees investors looking to buy more stocks and the higher demand will raise their prices. Investors looking to capitalize on the January Effect should buy stocks towards the end of December. Although, this pattern is common, it does not occur every time. The effect of Window Dressing Window dressing is a term given for the attempt by mutual fund managers and portfolio managers to show off to clients that they have acquired top-performing stocks. This is done at the end of the quarter when the underperforming stocks are replaced with winners. This affects the next quarter in the stock market as weak stocks fall further and successful stocks continue on their ascent. Year’s End This is a lot like the January Effect with the only difference being that it involves taxes at year's end. Higher tax deductions are possible when investors sell of weak stocks to limit the short-term losses. The Key Takeaway Mark Twain famously quipped that October was a dangerous month to invest in the stock market. He also stated that the other risky months "are July, January, September, April, November, May, March, June, December, August, and February." I get his point and he definitely has a great sense of humor. At the same time, there is plenty of evidence that point to the stock market performance being dependent on the time of year or even certain days in a month. A lot of this stock market activity that somewhat mirrors the past is due to human nature. Nonetheless, predicting the performance of the stock market is no trivial task. Historical data reveal certain patterns provide insights that traders and investors can use to make investment decisions. One of the best ways to profit from trading is to take into consideration the existence of seasonality in the stock market. Forecast The U.S. presidential election is almost here so investors may not get the maximum benefit of the 4-YCS. However, they can look to buy right now as this does not happen for four years and the next cycle will only be in 2016. Other dates to look out for are Christmas Day and the Fourth of July. Stocks have a tendency to perform well in the few days before a market holiday. I want to warn you here to exercise caution because if you went long in November 2008 and then sold in April 2009 according to conventional wisdom, it would have meant that your portfolio would have lost a lot of money. comments powered by Disqus |

|
|
|
|


