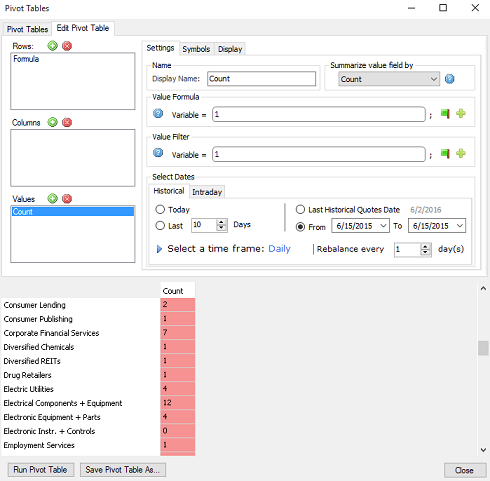
Few days ago we released the new 3.4.2 version of QuantShare. Below a brief description of some newly added features: Undo/Redo Feature We have implemented the ability to undo and redo any action you perform on a chart. You can draw a line, change a ticker symbol, create a new pane, edit formula... then use CONTROL+Z to undo the last action. Use CONTROL+Y to redo the last action. Each chart work independently and you can undo as many actions as you want by selecting a chart then using the CONTROL+Z hotkey several times. Pivot Table (Quant Tool) The pivot table is a powerful tool implemented several months ago. Before this new release, the only way to create a new pivot table was by creating a dashboard (Tools -> Dashboard) then right clicking on the dashboard and selecting "Create Pivot Table". We have now made it easier to create, modify and run pivot tables by implementing a new control (Analysis -> Pivot Tables). The new control looks similar to the screener tool. All you have to do is click on the "Create a new pivot table" button then adding rows, columns and values. To learn more about pivot tables, please read the following blog posts: Pivot Tables in QuantShare Trading Software Create a Pivot Table that displays the Relative Strength Index - RSI How to Display the Year-to-Date Excess Return in a Pivot Table How to display the number of stocks per day for different RSI groups How to create a correlation matrix of several securities  Equity vs Benchmark Return You can now compare your strategy equity curve daily, weekly, monthly or yearly return with a specific benchmark. In order to do that, backtest your trading system then select the "D.W.M.Y" tab. Next to "Benchmark Symbol", type a symbol name (Example: SPY, IWM... make sure you have downloaded data for that benchmark symbol), select a start and end date then click on "Update". For easier comparison, the benchmark return will be displayed (in red) next to your trading system return (in blue). You can zoom in and out by editing the start and end date. Importing and Backtesting Bid/Ask Data Importing trading data can be done through the ASCII Importer tool (Data -> ASCII Import) or by creating a downloader. Here is how to import bid/ask data: - Open the ASCII Import tool - Add the file that contains bid/ask data then click on "Next" - In the "Time-frame" field, select "Tick" then add the different columns The "Quotes -> Close" column would be used import last, bid and ask data. To differentiate between these items, you should add an "OpenInt" column. If the "OpenInt" value is 0 then QuantShare will consider that the value associated with the "Close" field is the "Last" price (or tick/trade). If the "OpenInt" value is 1 then QuantShare will consider that the value associated with the "Close" field is the "Bid" price. If the "OpenInt" value is 2 then QuantShare will consider that the value associated with the "Close" field is the "Ask" price. You can either add a column with the different values (0, 1 or 2) in the file to be imported in QuantShare or you can use the pre-script tool to update the "OpenInt" column data programmatically. An example is available here. Now after import your bid/ask data, you can create a trading system that enter market order using the available bid/ask price instead of the next tick price. All you have to do is to add the following lines to your trading system: SetSimTiming(_Buy, _Close, -1); SetSimTiming(_Sell, _Close, -1); SetSimTiming(_Short, _Close, -1); SetSimTiming(_Cover, _Close, -1); Importing Metastock Data QuantShare is capable of reading data directly from a Metastock database. Here is how. The problem is that in this case, optimization and backtesting will run much slower than if the data was available in the native QuantShare database. This is the main reason we have added the ability to import/copy data from a Metastock database into a QuantShare database. Using the "Download Manager" (from the "Download" menu), create a new download item, click on "Add Url" at the top, type the Metastock path in your hard drive under the "URL" field then select "METASTOCK" as "Content Type". Click on "Parser" then finish the setup process. Lock a Chart Each time you select a new ticker in QuantShare, all the charts would be updated and the data for that new ticker will be displayed. If you want to keep a chart associated with a particular ticker symbol, click on the "S" button at the bottom of the chart then select "Lock Chart".
|

|
|
|
|


