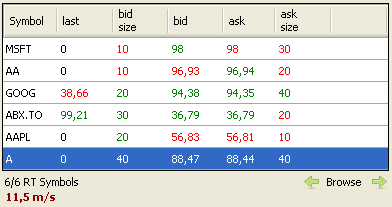
Using the watchlist tool, you can display real time data, create custom columns with custom indicators and rank all your securities based on any column. First we need to create a dynamic watchlist. Open the watchlist form by selecting "Tools -> Watchlist" In the watchlist form, click on "Create" at the top then click on "Create a dynamic watchlist" The first step would be to select the securities that must to be included in your watchlist. You can do that by adding a condition in the "Select Symbols" control. You can add symbols manually by selecting "Add a new condition -> Custom Symbols" or you can choose any other existing condition to select the securities you want to track. Click on "Next" to bring the next panel. In this panel, you will have to enter your watchlist formula and also select the time frame and data provider to use. The formula has two purposes: 1/ It allows you to filter securities and display only the securities that meet your criteria As an example, let us say we want to display all securities whose RSI is above 70. For this, you just have to type one line: filter = rsi(14) > 70; If we want to add a second condition (Stock price above $10) then the formula becomes: filter = rsi(14) > 70 and close > 10; The same formula can also be written like this: a = rsi(14) > 70; b = close > 10; filter = a and b; In case you want to display real time data for all symbols, just type: filter = 1; To learn more about the QuantShare programming language, please take a look at this blog post: QuantShare Programming Language Tutorial 2/ It allows you to add custom columns that will be updated in real time To add a custom column programmatically, you just need to call the "AddColumn" function. As an example, say we want to display the last value of the relative strength index, the last price, the bid price/size and the ask price/size. Here is what you need to type in this case: AddColumn("Last", close); AddColumn("Last", round(rsi(14), 2)); AddColumn("Bid Size", bidsize); AddColumn("Bid", bid); AddColumn("Ask", ask); AddColumn("Ask Size", asksize); Period and Data Provider In the "Period" pane, you can specify which time frame or period to use by the watchlist. Click on the link next to "Select a time frame" then select the periodicity. Note that you can add custom periodicity by selecting "Custom" then specifying the number of seconds that it takes to build a bar. Click on the "Options" link to specify whether to use data outside regular hours or not. To create a real time watchlist, we need to select the real time data source (Note that this requires that you have the real time license). Check "Real-time" checkbox then select your real time data provider from the list. You can check "Analyze on each incoming tick" to update the watchlist on every new tick or uncheck it to update the watchlist only when a bar is completed. If you uncheck this option and select a 1-min time frame then your watchlist will be updated once a minute (after the last trading bar is fully built). Note: To add a new data provider, select "Accounts -> Connect" from the top menu of QuantShare. Click here for a list of currently supported data providers.  Create a floating watchlist To create a floating watchlist, just click on the watchlist title bar then move it. To dock it again, keep pressing on ALT key, move the title bar of your watchlist then move your mouse arrow to one of the icons that appear on the screen. To create a new watchlist from an existing one, right click on the watchlist table then select "Create New Watchlist Window".
|

|
|
|
|


