


With historical data, the daily, weekly and monthly are the most used timeframes in technical analysis. A daily chart displays quotes where each bar represents a daily session. In a weekly chart, each bar summarizes the trading data that occurred, for a particular security, during a week. The bar open price is the security open price on Monday and the bar close price is the security close price on Friday. In a chart and at any moment you can choose the timeframe to work with by clicking on the "bottom-left" button. 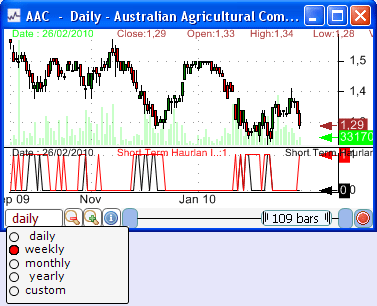 You can choose whether to display daily, weekly, monthly, yearly or custom timeframe. Custom timeframe option let you define a number of days to use as a timeframe. You can also change the chart timeframe by right clicking on a chart and then selecting the "Chart Timeframe" option in the menu. We will now present some timeframe-related functions in the QuantShare language that allow you to use different timeframes in the same formula. In a daily chart, you can for example calculate the Moving Average Convergence/Divergence, MACD, using a weekly timeframe and compare the result with the MACD of a daily or monthly timeframe. These functions can be used in charting as well as with other plug-ins like the screener, backtester, neural network... They can be used in technical analysis, fundamental analysis ... In the indicators list, you can see these functions and their descriptions by selecting the "Time-Frame" category; or you can just type "timeframe" in the "Search" field. 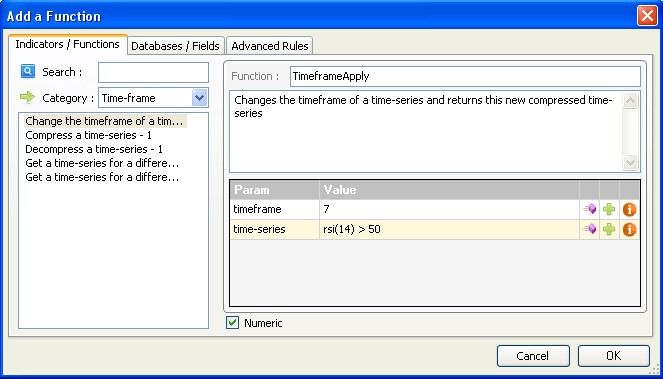 There are 7 time frame functions, but before we dig deeper into these functions, let us first explain the notion of "compressed" time-series. In a daily time frame, all functions are calculated using daily data. If you have two years worth of data for a particular stock, you will get approximately 500 bars. If you calculate the RSI of that stock, then the RSI will return a time-series with 500 bars. However, the RSI of the same stock and for a different timeframe will return fewer bars. Using a weekly chart, it will return 104 bars (52 weeks in a year multiplied by 2 years). Thus, we call this vector, a compressed time-series, because it has only 104 bars in a chart that displays 500. The missing bars will be filled with a NAN value (Not a Number). Here is how the weekly RSI looks like: 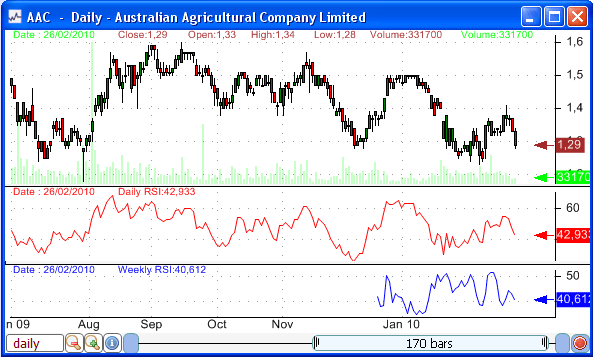 The Blue line is the weekly RSI. If you click on a bar, you will get the weekly RSI value for that bar and also the bar's date. This date corresponds to the bar's index in the daily chart and it does not correspond to the weekly RSI value. In the last bar, we have a value of 40.612 and a date of 26-02-2010. In reality, the value 40.612 corresponds to a bar that starts on 22-02-2010. To draw a daily RSI and a weekly RSI on the same chart, you can use the following formula: 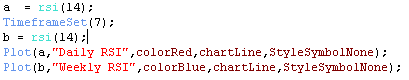 The first line creates the RSI vector, which is a daily vector because we are working with a daily chart. The second line is the first function we will introduce in this article. "TimeframeSet" is a function that tells the trading software to switch to another timeframe. A weekly timeframe has a value of 7. This is normal since there are 7 days in a week. 31 is the value you should use to define a monthly timeframe and 365 to define a yearly timeframe. Any other value can be used and it will be referred to as a custom timeframe. There are still 6 timeframe-related functions you need to know about. They will be presented and explained in the next post.
|

|
|
|
|

