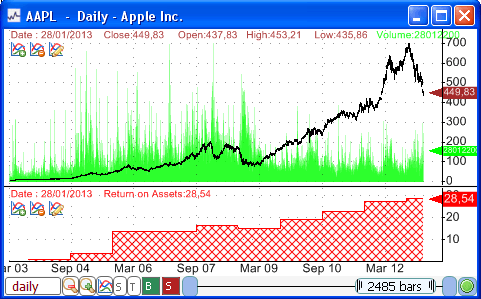
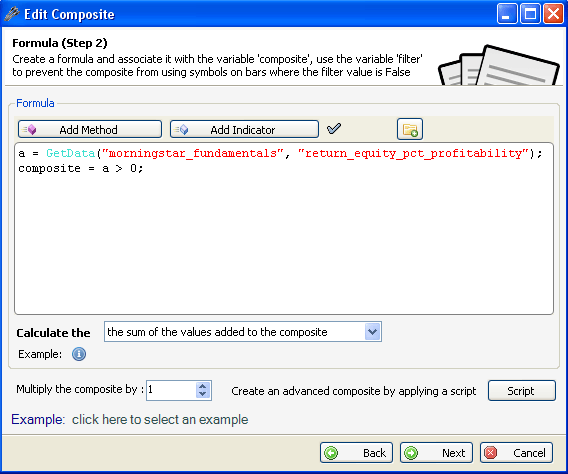
There are tons of market indicators based on prices and technical indicators. We have already created several blog posts about how to create some these market indicators: 4 original breadth indicators you should consider in your market timing strategy 4 Market Composite Indicators Based on Industry Data How to Select the Best Market_Indicator for your Trading_System However, no one is based on fundamental data. The idea is to create an indicator that shows the state of the market based on one or several fundamental items or ratios. As an example, we could create a market indicator that displays the number of stocks whose price earnings ratio is above 12. The time series that results could be used as an indicator for your market timing system or it could be used to detect potential market corrections. Downloading historical fundamental data Historical fundamental data is required in order to calculate past values of our market indicators. The following downloader (Morningstar Historical Fundamentals) gets yearly data of more than 80 fundamental item/ratio. Among these ratios, we can cite: Net Margin % Debt/Equity Quick Ratio Free Cash Flow/Sales % Return on Equity % Payout Ratio % Gross Margin % How to download data: - Select "Download -> Download Manager" - Select "Morningstar Historical Fundamentals" - Click on "Open Selected Downloader" then click on "Start Downloading" How to display the data: - Select "Data -> Edit Databases" - Choose "Custom" database then choose "morningstar_fundamentals" - Select the symbol for which you want to display the data on the right panel Access fundamental data using QS language The downloader we have introduced in the previous paragraph gets data for each U.S. symbol and stores this data into a custom database "morningstar_fundamentals". The QuantShare language has several functions to access custom database data and create time series from this data. For example, the "GetData" function retrieves historical data of any database field. a = GetData("morningstar_fundamentals", "return_on_assets_pct_profitability", Last); plot(a, "Return on Assets"); SetHatchBrush("DiagonalCross", colorRed);  As you can see from this picture, the above formula, when added to a chart, plots the changes of the Return on Assets ratio over several years. Of course, the "GetData" function can also be used to create trading systems, composites, watchlists, screens, neural network models... Number of Stocks with Positive Return on Equity The market indicator we will implement first returns the number of stocks that have a positive return on equity. Return on equity or ROE is the rate of return on the shareholders' equity. It measures the capacity of a company to use its investment funds to generate earnings growth. The ROE fundamental ratio is located under the "return_equity_pct_profitability" field of the "morningstar_fundamentals" database. To get the return on equity, simply type: a = GetData("morningstar_fundamentals", "return_equity_pct_profitability"); To create this composite: - Select "Tools -> Composites" - In the composites form, click on "Add" to create a new composite - Select the symbols that you want to include in the composite. Either select all symbols or select stocks from a specific market or index (such as S&P 500 stocks) - Click on "Next" then type the following formula: a = GetData("morningstar_fundamentals", "return_equity_pct_profitability"); composite = a > 0; - Select "The sum of the values added to the composite" as calculation method - Click on "Next" twice, set up a name then click on "Next" to create the composite and start the calculation process.  Number of Stocks with Increasing Free Cash Flow/Sales Ratio This market indicator returns the number of stocks whose free cash flow to sales ratio increased compared to the previous year. The free cash flow to sales is a fundamental ratio that shows how well the revenue of a company is transformed into cash. This ratio is stored under the "free_cash_flow_to_sales_pct" field. Here is the formula that you can use to create this composite: a = GetData("morningstar_fundamentals", "free_cash_flow_to_sales_pct", Zero); composite = a > 0; // Calculation Method: The sum of the values added to the composite Earnings-per-Share ratio of S&P 500 Stocks Here, we calculate the number of S&P 500 stocks with positive EPS (Earning per share) and subtract the result by the number of S&P 500 stocks with negative EPS. The earnings-per-share ratio shows the portion of a company's profit for each outstanding share. This ratio is stored under the "earnings_per_share_usd" field. The formula is: a = GetData("morningstar_fundamentals", "earnings_per_share_usd"); pos1 = a > 0; neg1 = a < 0; composite = pos1 – neg1; // Calculation Method: The sum of the values added to the composite As you can see from the three market indicators we created in this article, it is very easy to create fundamental-based composites. You can even create more advanced ones by using several fundamental ratios or combining technical and fundamental indicators.
|

|
|
|
|


