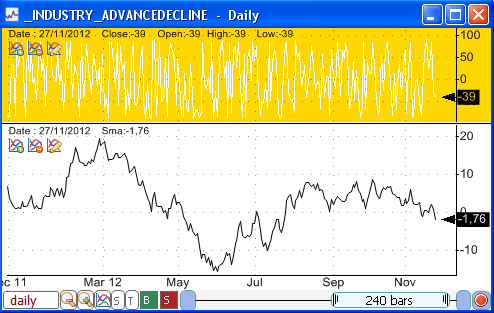
In the previous blog post, we talked about how to download industry data and associate industries with stocks. We then created a chart displaying stock quotes with its corresponding industry data and implemented a basic trading system that uses the industry relative strength indicator. If you haven't read yet that post, please click on the next link (Industry Analysis - How to Compare Stocks with their Industries) to learn how to download industry data and install the function that allows you to associate stocks with industries. When done, come back here to learn how to create 4 market indicators based on industry data. Number of stocks that are outperforming their industry First, let me show you how to create a composite. The composite manager, which contains all the composites you have created or downloaded from the sharing server, can be opened by selecting "Tools -> Composites". To create a new composite, click on "Add" button. Steps: Define symbols: Using the symbols filter control, add one or several conditions to filter the symbols that will be included in the composite calculation Formula: Type your composite formula; the composite time series will be constructed using that formula Calculation Method: Define what to do with symbol's values for each trading bar. Example: If you choose "Calculate the sum of the values added to the composite" and your composite contains 50 symbols, then each trading bar will have approximately 50 values (returned by computing the formula for each symbol). The composite value on each bar will be the sum of all symbols values. Period & Time frame: Define the calculation start and end dates as well as the period or time frame to use in the calculation. You can create EOD or Intraday composites. Ok, now that I have explained how to create a composite, let us start with our first industry market indicator. The "Number of stocks that are outperforming their industry", is a composite that counts the number of stocks that are performing better than their industry. The performance here is measure for the previous 25 bars (One month approximately). Steps: - Create a new composite - Include all your stocks or the ones that have "industry" field filled To do this, create a new "Symbols Info" condition in symbols filter. Click on the cell under "Values" and choose "industry". Type "([a-z]|[A-Z])*" next to "Search:". - In the composite formula editor, type: perfStock = perf(close, 25); i = GetSeries("^INDUSTRY_".IndustryIndex(), close, LastData); perfIndustry = perf(i, 25); composite = perfStock > perfIndustry; Formula Explanation: Line 1: Here, we calculate the performance of the stock for the previous 25 bars (return). Line 2: The industry price series is obtained using the "GetSeries" function. Line 3: Calculates the performance of the industry for the previous 25 bars. Line 4: Compares the performance of the stock with its industry. Return "1" if the stock's performance is higher than its industry's performance. - For the calculation method, use "Calculate the sum of the values added to the composite" Advancing-declining industries This is the number of industries that are advancing minus the number of industries that are declining. It is much like the advancing/declining indicator for stocks. This market indicator is created by adding all symbols whose name start with "^INDUSTRY" and then typing the following formula: adv = close > close[1]; // close compared to the close of the previous bar dec = close < close[1]; composite = adv - dec; The calculation method is: Sum of the values added to the composite. To add symbols, whose name start with "^INDUSTRY", create a new "Symbol Info -> Name" condition in the "Symbols Filter" of the composite (first screen) then type "^INDUSTRY*".  Number of stocks performing 5% better than their industry This composite calculates the number of stocks whose performance is 5% above the performance of their industry. The composite formula is as follow: perfStock = perf(close, 25); i = GetSeries("^INDUSTRY_".IndustryIndex(), close, LastData); perfIndustry = perf(i, 25); composite = perfStock > 1.05 * perfIndustry; The formula looks like the formula of the first composite. In this one, we have multiplied the industry performance by "5%" (1.05). The calculation method is: "Calculate the sum of the values..." Ratio of stocks outperforming/underperforming their industry This market indicator is calculated by dividing the number of stocks outperforming their industry by the number of stocks underperforming their industry. This is the most advanced composite, as it requires that we calculate two composites and use a C# script to create the ratio. The formula is as follows: perfStock = perf(close, 25); i = GetSeries("^INDUSTRY_".IndustryIndex(), close, LastData); perfIndustry = perf(i, 25); composite = perfStock > perfIndustry; // Outperform AddComposite("underperfom", perfStock < perfIndustry, _CompSum); // Calculation Method: The sum of the values added to the composite The first four lines are the same as in the "Number of stocks that are outperforming their industry" composite. The last function (AddComposite) creates a second internal composite for stocks underperforming their industry. The next step would be to create the script. - Click on the "Script" button under the formula editor (located at right), then type the following script: double[] outperform = Functions.GetVariable("composite"); double[] underperfom = Functions.GetVariable("underperfom"); for(int i=0;i < outperform.Length;i++) { double ratio = outperform[i]; // Default in case there are no underperforming stocks if(underperfom[i] != 0) { ratio = outperform[i] / underperfom[i]; } outperform[i] = ratio; // Replace outperform value with ratio value } Functions.SetCompositeData(outperform); // Set ratio array Basically, the script gets the underperforming and outperforming composites. It then loops through each trading bar and divide the former by the latter. The result is returned using the "Functions.SetCompositeData" function.
|

|
|
|
|


