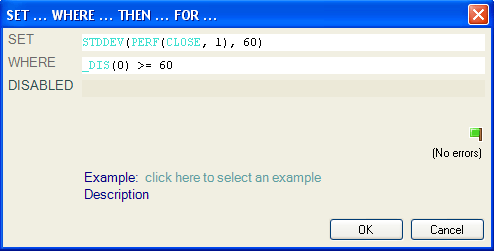
Financial assets are moving up and down every trading day and these fluctuations define the volatility of an asset. The higher the amplitude of the fluctuations the higher the volatility and consequently the higher the uncertainty and risk associated with that security. The volatility also takes a big part in the pricing of options and other derivatives. It is for example part of the Black & Scholes equation used for European-style options pricing. Investors and trades usually use the standard deviation to measure the historical volatility of an asset. The short-term volatility of a stock for instance is calculated by taking the standard deviation of N-past stock price returns where N is a low value (maybe between 10 and 60 depending on the definition of short-term). The above method of volatility calculation also called close-to-close estimator is one among many other volatility estimators available in the trader's arsenal. Other methods include the Historical High-Low Volatility: Parkinson, Garman-Klass Volatility Estimator, Rogers-Satchell Volatility Estimator and Yang Zhang extension of the Garman-Klass Volatility Estimator. Follow the links to download the trading indicators that will allow you to compute these different estimators. Forecasting volatility is very important in the financial markets but it is not an easy task to achieve. If you were able to forecast the volatility of stocks for the next 30 days then you will know exactly which stocks or options to invest in depending on your strategy objective. A stock market trader looking for a stable portfolio with lower drawdown and high Sharpe ratio may invest in stocks that are expected to have a lower volatility in the coming days. A short trader may choose stocks with higher volatility expectations and bet on a big drop in security prices. Rules Analyzer The "Rules Analyzer" tool of QuantShare allows you to create list of rules to analyze. The analysis can be based on any measure. For example, you can create thousands of trading rules and then analyze each one calculating the average future volatility following the signals of a rule. - Select "Analysis" then "Rules Manager" - Click on "Create" to create a new list - Type one or several trading rules The following posts will help you generate hundreds and thousands trading rules very quickly: 10 masks to create thousands of rules to use into your trading system How to create and backtest thousands of trading rules in less than 10 minutes - When you are ready, click on the "Analyze the list" button - Select "Symbols & Period" tab and specify the symbols you want to analyze as well as the time frame and the analysis period. - Select "Outputs" then click on "Select Outputs / Exit rules" - Uncheck existing outputs, select "Custom Output", click on "Edit" then define the future volatility as follows: SET stddev(perf(close, 1), 60) WHERE _dis(0) >= 60  Interpretation: "Set" command is a special function that calculates a specific formula on the bar where the "WHERE" condition occurs. It starts at the next bar and calculates the "Where" formula. If the formula returns "false" then it moves to the next bar and calculates the "Where" formula again. If it returns "true" then the formula next to "Set" is calculated and its value associated with the current bar. In this case, it will calculate the 60-bar standard deviation that occurred after 60-bar. Example: The bar number 200, will get the volatility of bar 260. "_dis" function measures the distance in bars between the current bar and the analyzed bar. Another way to measure the future volatility is by using the build in function "_ds". Example: Set _sd(perf(close, 1) WHERE _dis(0) >= 60 Additional information regarding the "Set" function can be found in QuantShare documentation. The following article also makes use of the "SET" function: How to simulate options strategies. Neural Network Another technique to predict or forecast volatility is by using neural networks. The AI Neural net tool of QuantShare allows you to specify inputs (Example: Past volatility, indicator values, prices...) and future volatility as output and thus create a prediction item that will try to predict future volatility of any asset. The prediction item or model needs to be trained with past data. Trading System The final step would be to include these prediction items or trading rules in your trading systems so that you can make buy and sell decisions based on volatility forecasts.
|

|
|
|
|


