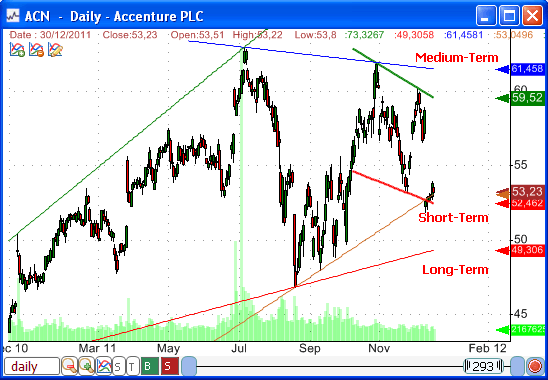
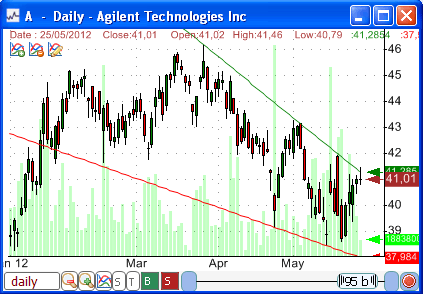
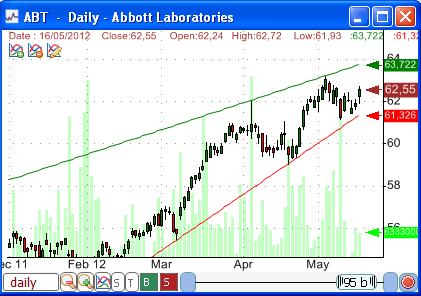
Among the +30 available drawing tools, the Automatic Support/Resistance is probably one of the most important and interesting one. It was certainly the hardest one to develop mainly because all the optimizations that was done to make it less CPU (processor) intensive. The auto Support/Resistance plots resistance and support lines for a specific period. Unlike classic tools that draw two horizontal lines (one for the high and one for the low), this item draws oblique lines that perfectly fit with market ups and downs. These trendlines helps you determine market direction, reversals and breakouts. They are also the basis of several chart patterns. Based on the period or number of bars used to draw these trendlines, you can perform short-term, medium-term or long-term analysis.  Auto Support/Resistance Function We have introduced recently a new trading indicator called "AutoSR". It performs the same calculation that is behind the auto support/resistance drawing tool, meaning that this function displays the most recent trendlines. There are two major advantages of using this function: 1- It can be used in a watchlist or screener to analyze chart patterns of thousands of stocks and detect for example breakouts and reversals. 2- The function can calculate the support and resistance level of each trading bar and thus it can be used to perform advanced backtests (This feature as well as several trading system examples will be detailed in another article). In this configuration, the automatic support and resistance levels are calculated for each trading bar based on the previous N-bars. Example: a = AutoSR(0, 0, 50); plot(a, "", colorRed, ChartLine, StyleNoScale); a = AutoSR(1, 0, 50); plot(a, "", colorGreen, ChartLine, StyleNoScale); To add the above formula to a chart, right click on a chart, select "Edit Formula", type the formula then click on "Update Graph". The first line creates the support line based on the previous 50-bar. The second line plots the support line. "StyleNoScale" is used so that the line does not update the chart scale. Description of the parameters of the "AutoSR" function: SR: Set "0" to create a support line or "1" to create a resistance line. Lag: Specify when the trendline should end. Set "O" to end the trendline at the last bar. Set "1" to create a trendline that ends at the bar before the last one. Length: Specify the number of bars to use to draw/calculate the trendlines. The "Lag" function is a very useful in detecting breakouts and reversals. Example: Scan stocks that broke their short-term resistance line Our function will never return any result if we set the "lag" parameter to zero. This is because the resistance line is always above security prices. To detect breakouts, we should set a "lag" value of "1". If the price closes above the previous bar resistance line then a breakout is detected. Here is the formula: filter = close > AutoSR(1, 1, 50); In the next paragraphs, I will show you how to detect some popular trading patterns using the "AutoSR" function. All these patterns can be detected using any time frame, including: weekly, daily, intraday and tick period. This function is very powerful and unique to QuantShare. You will not find it in other trading software programs. Chart Patterns: Falling Wedge The falling wedge is a bullish pattern that is formed when the asset makes lower lows and lower highs and at the same time, the range formed by the support and resistance lines is contracting. A buy signal should be generated when the price crosses above the resistance line. The falling wedge pattern can be detected programmatically using the "AutoSR" function. How to scan the falling wedge chart pattern: - Select "Analysis -> Screener" then add a new screen - Generate a one-bar lagged support and resistance lines using "AutoSR" period = 50; // The period used to calculate the trendlines res = AutoSR(1, 1, period); sup = AutoSR(0, 1, period); - Calculate the support and resistance angles using the linear regression angle function resAngle = LinearReg_Angle(res, period); supAngle = LinearReg_Angle(sup, period); - Detect a falling wedge when the resistance line angle is negative and higher than the support line angle. The latter angle should also be negative. filter = resAngle < 0 and supAngle < 0 and supAngle > resAngle;  Rising Wedge The rising wedge is a bearish pattern that is formed when the asset makes higher highs and higher lows and at the same time, the range is contracting. A sell signal should be generated when the price crosses below the support line. To detect rising wedges simply follow the logic described in the above section. A rising wedge is signaled when the support line angle is positive and higher than the resistance line angle. The latter angle should also be positive. The following screen detects wedge patterns: Falling Wedge and Rising Wedge Patterns  Ascending Triangle Unlike the falling and rising wedges, which are called reversal patterns, the symmetrical, ascending and descending triangles are called continuation patterns. This is because the trend is likely to continue in the same direction after the price breaks the pattern formation. The ascending triangle is a bullish technical analysis pattern that consists of a rising support and a horizontal resistance line. How to detect the ascending triangle chart pattern: - Select "Analysis" then "Screener" - Click on "Create a new screen" - Type the following formula: period = 50; res = AutoSR(1, 1, period); sup = AutoSR(0, 1, period); resAngle = LinearReg_Angle(res, period); supAngle = LinearReg_Angle(sup, period); resAngle = Absolute(resAngle); filter = supAngle > 0.5 and resAngle < 0.01; filter = filter and close < sup; The above formula calculates the angle of support and resistance lines to determine if the pattern is an ascending triangle. It then detects a bullish signal if the price crosses below the support line. Descending Triangle The descending triangle is a bearish pattern that consists of a falling resistance and a horizontal support line. How to detect the descending triangle: period = 50; res = AutoSR(1, 1, period); sup = AutoSR(0, 1, period); resAngle = LinearReg_Angle(res, period); supAngle = LinearReg_Angle(sup, period); supAngle = Absolute(supAngle); filter = resAngle < -0.5 and supAngle < 0.01; filter = filter and close > res; As with the ascending triangle example, the last line allows you to scan stocks breaking their triangle pattern. You can ignore this line to simply return all stocks that have the descending triangle formation. Symmetrical Triangle Sometimes referred to as a coil, the characteristics of a symmetrical triangle is as follows: A rising support line and a falling resistance line (converging trendlines) How to detect a symmetrical triangle: period = 50; res = AutoSR(1, 1, period); sup = AutoSR(0, 1, period); resAngle = LinearReg_Angle(res, period); supAngle = LinearReg_Angle(sup, period); filter = resAngle < -0.5 and supAngle > 0.5; filter = filter and (close < sup or close > res); In a next post, we will show you how to create trading systems/strategies and backtest these patterns.
|

|
|
|
|


