


Rules analyzer and Custom outputs The rule analyzer tool of QuantShare is a great way to find rules that produce good outputs. Outputs are fully customizable and generally refers to a security return (over a period of time, or given any exit or stop rule). However, you can setup outputs to return something else and this opens up a wide range of possibilities for traders. The output could be something like: The future volatility, that is the standard deviation of N-Bars in the future A binary value that takes a value of one if a specific event occurs The excess return (given a benchmark) The return of a simulated call option The return of a simulated Asian option How the rule analyzer is different from the simulator? Besides custom outputs, the main difference between the simulator and the rule analyzer is that the latter calculates metrics for all referenced symbols, while the simulator is a True Portfolio Backtester. The Simulator is aware of the cash balances and the value of positions within the account at any moment and thus only portion of symbols are analyzed and this results in a more realistic simulation. Both are useful because they serve different purposes. Rules Analyzer Metrics The results produced by the rule analyzer could be used to perform statistical analysis, create trading systems by including profitable rules for example or improve existing strategies. As an example and given an output that calculates the future volatility, we could analyze hundreds of trading rules and pick the ones that have the higher output (higher future volatility). These rules can then be added as exit rules in a trading system to reduce its overall volatility. 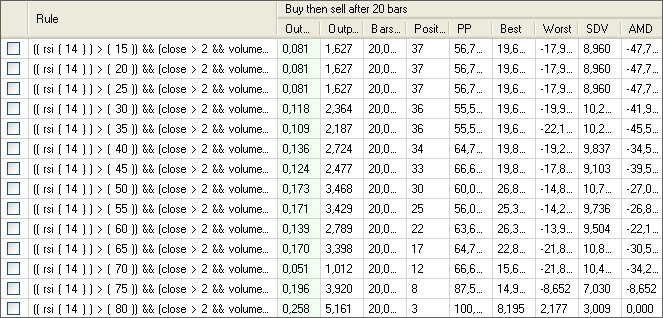 In order to speed up the analyzing process, the rule analyzer produces few metrics. The calculated metrics are: Average output, Average output per bar, Average bars held, Number of positions, Percent positive positions, Best position output, Worst position output, Outputs standard deviation. However, using the script language, you can create as many custom metrics as you want. You have access to all generated positions with the security symbol name, the number of bars held, the date of the signal and the output value. This lets you create easily any kind of metric, and if you don't know how to create them, you can always download the ones that were shared by other users (this is also a great way to learn how to create your own scripts). This was an introduction to the rule analyzer and once you start using it, you will realize how powerful it is. In the next post, we will calculate a metric called the average maximum drawdown. We will show you how to calculate the maximum drawdown for each symbol to create the AMD (Average Maximum Drawdown) metric.
|

|
|
|
|

