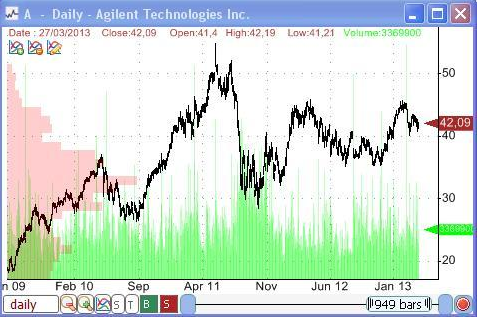
You can plot profile graphs on QuantShare by using the "PlotProfile" function. To learn more about the QuantShare programming language, please check this. Here is how a profile graph looks like. The graph in red displays the volume by price. By looking at the chart, you can quickly see at which price range the highest volume occurred. These could be potential support and resistance areas.  And here is the function used to display that profile: PlotProfile("volume", 0, 1, 100, colorRed, colorRed, OperationSum); The profile function isn't designed to show only volume but can be used to display anything. Here are some examples: Number of instances where the asset closed higher (close > open) displayed per price range and for each trading year (new/different profile for each year) PlotProfile("close > open", year() != ref(year(), 1), 1, 100, colorBlue, colorBlue, OperationSum); Average RSI by price range PlotProfile("rsi(14)", 0, 1, 100, colorBlue, colorBlue, OperationAvg); Daily volume profile on a weekly price PlotProfile("volume", 1, 1, 5, colorRed, colorRed, OperationSum); The function contains several parameters. Formula: Defines the profile formula For a profile graph based on volume, simply type: "volume" For a profile graph based on 25-bar simple moving average, type: "sma(25)" New Profile Condition: Specify when to create a new profile To display only one profile for all trading data, type: 0 To display one profile for each trading bar, type: 1 In a daily chart and in order to display one profile per week, type: week() != ref(week(), 1) Time frame: Specify the time frame used to calculate "Formula" Number of buckets: The number of buckets (price range) for each profile Back Color: The back color of profiles Font/Border Color: The font and border color of profiles Operation: Specify the operation to perform in this profile and some styles. You can separate values using the character | OperationAvg: calculate the average of the "Formula" values for each bucket OperationMax: calculate the maximum of the "Formula" values for each bucket OperationMin: calculate the minimum of the "Formula" values for each bucket OperationRank: calculate the rank of the "Formula" values for each bucket OperationSum: calculate the sum of the "Formula" values for each bucket ShowBorder: Display profile borders ShowValues: Show the value of each profile bar UseRthOnly: Uses data from regular trading hours only (intraday) Note: 1/ If you have an EOD chart and you want to use intraday data in your profile graph, simply use a negative value as "Time frame". Same for Intraday charts. 2/ For EOD data, time frame is expressed in days 3/ For Intraday data, time frame is expressed in seconds In a future article, we will show you how to access profile data using C# and create advanced custom functions based on the profile data.
|

|
|
|
|


