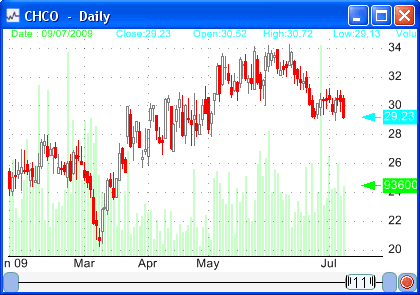
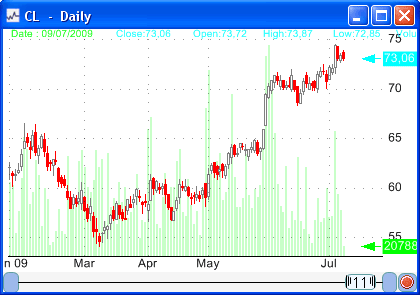
Look at these charts.   Did you notice what they have in common? They both have the same return. But do you know what is the difference between them? It is the volatility. The first stock moves up and down more frequently and with higher amplitude than the second stock. This translates into a higher volatility. The volatility is a measure of the variability and the degree of fluctuation of a time-series or an asset. The higher the volatility is the more fluctuations and unexpected moves happen to a security compared to a security with low volatility. Example: A stock that went up 3% yesterday and went down 10% today has more volatility than a stock that increased 1% yesterday and 2% today. The estimation of the future realized volatility in trading is important, but very difficult. Stock traders can use this information to adjust their portfolios, reduce their risks, and options traders can use it to trade against the options implied volatility... Before estimating this future volatility, a trader should first calculate the historical volatility. This volatility (Historical) is calculated by looking at the past bars of the security or stock. The more common and well-known method to calculate the historical volatility is called the close-to-close volatility estimator. This estimator consists of calculating the standard deviation of the logarithmic returns over a given period of observation. The issue of the period of observation or lookback period can result into a proliferation of historical volatility values. In fact, even if the close-to-close volatility is an annualized value, using different period of observations can lead to different results. As example, if we use a daily standard deviation and multiply the result by the annualization factor we will get a different result than if we had used a weekly standard deviation and its associated annualization factor. Note that, the annualization factor is the square root of the number of trading days in a year (252 in the United States) divided by the number of days used to calculate the raw standard deviation value. There is no such best look-back period to use for the calculation of the historical volatility and each trader chooses the period that suits him best. A low period catch the most recent volatility trend in a stock but can result in a great amount of noise, while a long period catch the long-term volatility trend. Another issue concerns the estimator to use to calculate the volatility, we just saw the close-to-close volatility estimator, but there are many other estimators, each one with its own benefits and drawbacks. The Historical High-Low Volatility: Parkinson Estimator calculation uses the daily range and can then capture the intraday move, however it cannot handle trends and jumps and it systematically underestimates the volatility. The Garman-Klass Volatility Estimator is up to eight times more efficient than the close-to-close estimator. It also uses almost all the available price information; however, this estimator is more biased than the Parkinson estimator. The Rogers-Satchell Volatility Estimator allows for the presence of trends (non-zero drift), but it doesn't account for jumps. The Yang Zhang extension of the Garman-Klass Volatility Estimator is the one that has the lowest estimation error, it handles both drift and jumps and it is 14 times more efficient than the close-to-close estimator. The bad news is that this estimator performance degrades to that of the close-to-close estimator when there are several opening jumps in the price series. The conclusion regarding these estimators is that there is no such best estimator. As we have indicated, each one has its benefits and drawbacks and the best thing to do is to combine different estimators' value to take a decision. Here is the close-to-close estimator formula in the QuantShare trading software: a = Log(close / ref(close, 1)); volatility = Stddev(a,30) * Sqrt(255 / 30) * 100; For the other estimators, you can click on each estimator link to download its function.
|

|
|
|
|


