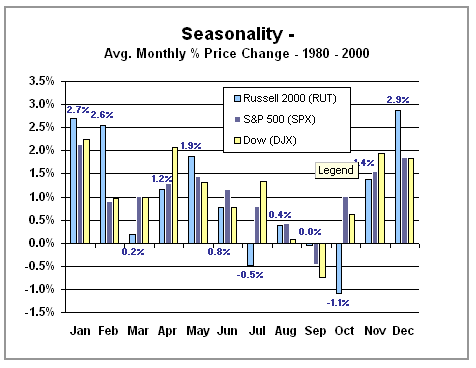
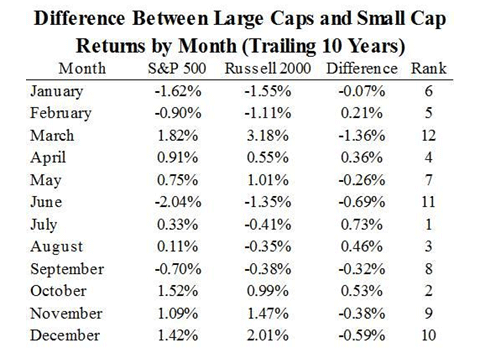
Much has been said of the January effect on stock market. Some traders would stake their fortune on the validity of such observed pattern in the movement of stocks. While some would attribute such effect as a thing of fiction. But what is it really? And is it a dependable pattern that traders can tap into? In this article, we cover on the facts and fiction that surrounds this curious pattern of the stock market. What is January Effect? The following patterns are commonly attributed as January effect on the stock market: - January effect refers to the rally of stock prices in the first few days of January. The increase usually happens on the first five days of January. There are many theories given for such pattern in stocks’ prices. In fact, many theories arose from such parity. - Another assumption referred to as January effect on the stocks market is the belief that as January goes so will the rest of the year. Some investors believe that the first few days of the trading year will set the tone for how stocks will trade for the whole year. For example if the market experienced a bullish pattern on the first few days of January will mean a gainful year for investors. A bearish January will most likely mean a weak market for the succeeding 11 months as well. Thus, investors who put much weight on this assumption would be on their toes to keep an eye on how January’s market direction pans out since it will set the tone for the entire year and it will help them navigate their investments for the months to come. - Lastly, another idea that’s attributed as January effect is the assumption that small caps and beaten-down shares of companies tend to outperform that of larger ones in the first month of the year. This effect has weight only during the month of January. Theories Behind January Effect There are some explanations given for these patterns observable in the month of January. Below are the most common ones: - The most common theory attributed to the price rally in January is that investors are buying stocks following a sell-off from the previous month. December is the time when there’s a massive sell-off since investors are prompted to get rid of their stocks to avoid paying capital gains taxes. In the recent years, the pattern has been less pronounced since investors are using tax-sheltered retirement plans so there’s no use to selling their shares to avoid taxes. - Another theory given is that bonuses are given in January. Therefore, the extra cash is being invested in stock market boosting the prices of stocks. However, this theory is less supported than the previous one. - As for the “As January goes so will the rest of the year” adage, the obvious explanation for this is that when investors have optimistic views on the market, they’ll most likely act upon such assumption and take a position as early as possible. The same thing goes when the outlook is that of a bearish market. - As for small-caps vs. large-caps assumption, the explanation behind this is not really geared towards small-caps stocks or large-caps performance. Rather, it’s more on the sell-off of losing shares or weaker performers that happens on the previous month for tax purposes. Then, fund managers or investors buy them back at the beginning of the year boosting the prices of the previous year’s weak performer. Are These Patterns and Theories Supported by Historical Data? The best way to gauge whether different assumptions and theories surrounding January effect on stock market holds enough water for investors to act upon is to check if there is quantifiable evidence supporting it. Since there’s no way we can go forward in time, the best way to gauge January effect’s’ validity is to scan historical data and see if numbers support these assumptions. Below, we walk through the evidence or non-evidence of the so-called January effect. - There are many ways to gather supporting numbers if the January effect does indeed holds true in terms of rally in stock prices. Below is the average performance of S&P 500 (SPX), Russell 2000 (RUT) and Dow (DJX) over the course of 20 years.  Based on the data above; there’s a spike in stock prices in the month of January and December on an average. However, this rally is more pronounced on small-cap market as represented by the Russell 2000 Index. Over the course of 20 years, large-cap companies do not show conclusive evidence of January effect using this historical data. - There have been several researches that support the assumption that small-cap stocks performs better than large-cap stocks. For example, Steven DeSanctis, a strategist at Bank of America Merrill Lynch as well as Mark Haug and Mark Hirschey at University of Kansas all confirmed that from 1926-2004, small-cap stocks indeed outperformed large cap stock 70% of the time. However, it is also important to note that in the recent years, the difference in the performance of large and small-caps stocks in January is not as pronounced. Take for example, the data below:  These numbers on average for the past 10 years do not support the premise that small-cap stocks performs better than large-cap stocks in the month of January. - As for the adage “As January goes so goes the rest of the year”, there has been enough numbers to support this claim. Since 1945, the market tends to be bullish following a bullish January 80% of the time. And since 1950, a bearish January tends to make the rest of the year flat or bearish more than 80% of the time. And though the correlation is high, there is a caveat that most of us tend to overlook: a bullish year would mean bullish months of February, March, April and so on – not just January. Conclusion Numbers and data can vary from one researcher to the next. As much as there are numbers that support the premises of January effect on stock market, there are some that are not supported by quantifiable evidence. And even if an assumption is backed by historical data, there’s no guarantee that the market would move in the exact same in the future. There may be strong correlation on stock’s performance in the month of January and its movement for the rest of the year, but it’s pretty much like a coin toss – even if you get 10 heads in a row, there’s still 50% chance you’re going to get tails in the next toss. Therefore, it’s still wise for an investor to not heavily rely on January effect and hold on to plain old common sense when playing the stock market.
|

|
|
|
|