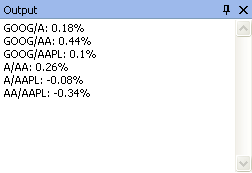
By comparing several stocks or assets you can quickly identify correlated stocks, which one performed best, which one has the biggest drawdown... This comparison can be performed by creating a relative performance chart. You will learn how to create this chart and how to use it in QuantShare trading software. Create a Custom Indicator The first step would be to create a custom indicator that given a reference date and a list of symbols plots the performance of each symbol, in percentage, starting from the given date (At that date, the value of the line starts at 0%). Custom indicators/functions are created using CSharp or JScript.Net programming languages. To open the custom indicator manager, select "Tools" in the main menu then click on "Create Functions". To add a custom indicator, click on "Add", type the function name (Example: CompareAssets) then click on "OK". The script can be found here. You will find a brief description of each line of code. The indicator requires that you add two variables ("Assets" and "Date", both of string type). Create a Relative Performance Chart Now that you have created your own indicator, it is time to plot the relative performance lines on a chart. - Create a new chart - Click on "Add Indicator" (top-left corner) - Select "All Indicators" tab then type "CompareAssets" in the "Search" input box - In "Params" tab, type the assets you want to compare (separated by semi-colons) and pick a reference date. Each parameter must be enclosed by double quotes.  Add a new asset to the performance chart To update the relative performance indicator settings, simply click on the third top icon (Update Indicator) then select "CompareAssets". By updating "assets" or "date" field, the new changes will be automatically reflected in your chart. Note that you can add as many stocks/assets as you want and each asset will be plotted in a different color. Display differences in the interpretation Window The modification that we are going to implement will measure the difference in percentage between each asset and then display these differences in the "Output" window for the selected bar. This means that when you move your mouse over the relative performance chart, the percentage differences that correspond to the selected trading bar will be displayed in the "Output" form. This form can be opened by selecting "View" then "Output". - Open the "Create Functions" tool and select the "CompareAssets" indicator - Click on "Return Numeric Array" (bottom) to uncheck it Note that after changing the return type of the function to string/text, the "CompareAssets" indicator is displayed in "Add Indicator" form only if you uncheck the "Numeric" option. Code Changes: - Just after "Color[] colors" line, add the following code: VectorD[] vectors = new VectorD[assets.Length]; - After the "Chart.Plot" line, add the following code: vectors[j] = res; - At the end of the script, add the following code: for(int i=0;i < result.Length;i++) { for(int j=0;j < assets.Length;j++) { for(int z=j+1;z < assets.Length;z++) { if(assets[j] != assets[z]) { result[i] = result[i] + assets[j] + "/" + assets[z] + ": " + Math.Round((vectors[j][i] - vectors[z][i]), 2) + "%" + Environment.NewLine; } } } } The output will look like:  It shows the difference in percentage, for the active date, between four stocks: Google, Agilent, Alcoa and Apple. The first line tells us that the difference between Google (Ticker Symbol: GOOG) and Agilent (A) is 0.18% More Ideas - Display the relative performance between an index and trading system/strategy equity: To create this chart, backtest a strategy, right click on the graph (In Report for trading system) then click on "Equity to Symbol". This will create a new symbol that contains the previous trading system equity. The final step is to add the index (Example: S&P 500 or Russell 2000) and trading system symbols to your formula parameter. Example: "^GSPC;~Simulation 1" - Update stock symbols used in a relative performance charts simply by selecting symbols in a watchlist: The idea is to create a global script (Tools -> Script Editor) that detects changes in the clipboard (using "Clipboard" class) and then update the formula of the active chart. You just need to select symbols in your watchlist then right click and select "Copy symbols to clipboard". A Ready to Use Relative Performance Chart Indicator The relative performance chart indicator is already available in the sharing server and it can be downloaded here: Relative Performance/Return Chart - Compare Several Assets/Stocks. After you download this trading indicator, follow the steps described in "Create a Relative Performance Chart" to complete the process.
|

|
|
|
|


