How to create a hatched area in a chart
Updated on 2011-12-31 03:43:48
|
Steps:
- Right click on a chart then click on "Create new pane"
- Right click on the new pane then click on "Edit formula"
- Type the following lines to add a moving average indicator
a = sma(close, 30);
plot(a, "SMA", colorRed, ChartLine, StyleOwnScale);
- To create a hatched area, we must use the "SetHatchBrush" function.
Type the function just after the indicator you want to update.
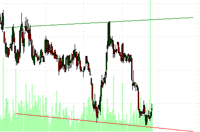
Example Chart 1:
SetHatchBrush("BackwardDiagonal", colorRed);

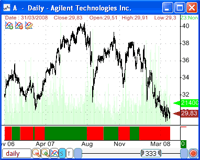
Example Chart 2:
SetHatchBrush("SmallGrid", colorRed|100);

By adding "|100" next to "colorRed", we instruct QuantShare to set the opacity of the red color to 100 (0 = transparent, 255 = opaque)
To list the different hatch brushes, set the mouse cursor after "SetHatchBrush(" then use the CONTROL+SPACE shortcut.
There are more than 50 hatch brushes, including:
Cross
DarkDownwardDiagonal
DashedHorizontal
Divot
DottedDiamond
LargeCheckerBoard
Percent25
|