View->New chart
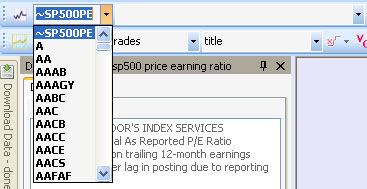
Select a chart, and then select a symbol
from the tool bar; the chart symbol will be automatically updated.
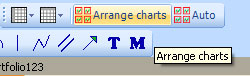
To arrange charts, click on the button
shown below.
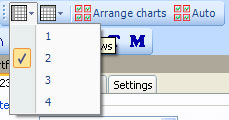
You can also specify how to arrange charts
by specifying the number of row and column.
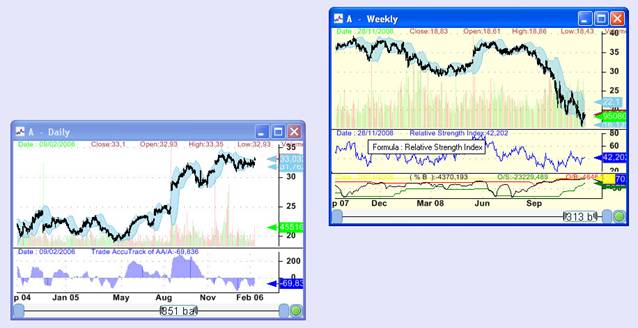
A linked chart
is a chart that is linked with another one.
If chart 'A' is linked to chart 'B', then if we change the chart 'B' symbol
then the symbol of chart 'A' will be updated as well.
To create a linked chart, select a chart
then select (View->New linked chart)
To display a
list of shortcuts, click on 'Divers' in the bottom tool bar, then click on
'List of Shortcuts'.
To zoom into a chart, click on CTRL then
use the mouse wheel to zoom in and zoom out.
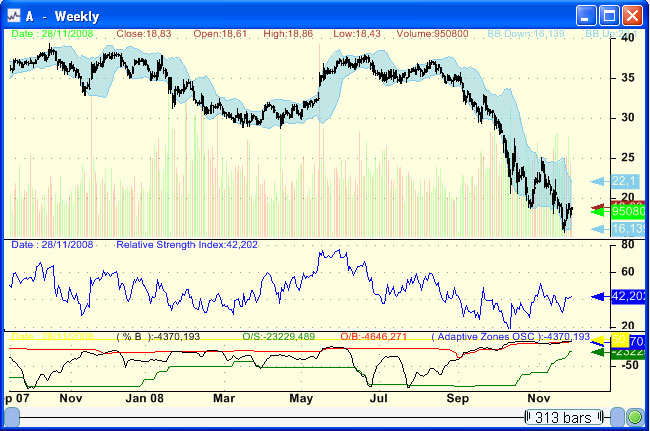
Each chart is a collection of panes; a
chart can contains one or several panes.
Each pane contains a template and one or many formula files.
Example of chart with three panes:
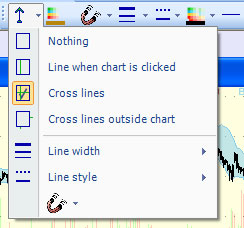
There are three select tools available:
- Line when chart clicked
- Cross lines
- Cross lines outside chart
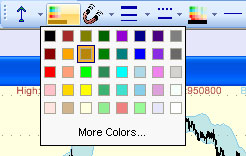
You can specify some settings like color,
line width, Stick to (See Drawing tools)...
Available periods are day, week, month,
year, and custom.
Custom periods let you select the number of days to use as timeframe.
To change a chart timeframe, you have to right click on a chart, select 'Chart
Timeframe' in the menu and then select the timeframe.
You can drag and drop formulas from a pane to another one.
If you click on a curve or a bar, the application will detect what formula this
curve or this bar belongs to, you just have then to drag and drop this formula
to another pane.
Click on a study then drag & drop
to another pane
|
|
You can also drag and drop a formula to the widget or bookmark panel.
Note than unlike the majority of the other items (Trading systems, watch-lists,
composites ...), when the drag & drop process completes, a copy is saved
and not a reference.
This means that if you drag and drop a chart formula to the bookmark panel,
then you update the formula in that panel, the chart formula will not change.
Charts are formula based.
You can create charts without writing any line of code, or you can create
complex charts using the QuantShare Language.
You can plot
candlesticks, lines, bars, smoothed lines, step lines, symbols, and texts.
There is also a special type of graphs called
fixed graphs.
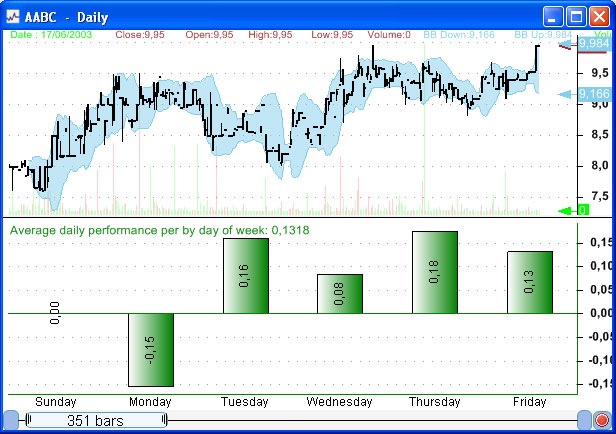
You can plot for example something like "Average daily performance for each day
of the week", or "number of days up and days down for each month"...
Here is the formula syntax:
PLOTFIXED(vector1, vector2, string vector,
calculation function, description, color, ChartStyle, Style);
Let us imagine we want to calculate the
average closing performance for each day of week.
Vector1:
(Day of week) (one means Monday, two for Tuesday...)
Vector2: (Close price)
|
10
|
11
|
12
|
10
|
8
|
6
|
9
|
11
|
13
|
12
|
Intermediate vectors:
X vector:
Y vector:
|
10
|
11
|
12
|
10
|
8
|
|
6
|
9
|
11
|
13
|
12
|
Then if we have selected "Sum" as calculation function, we will have:
Y vector
In our case, we want the average closing
price so Y vector will look like this:
|
8
(10+6)/2
|
10
|
11.5
|
11.5
|
10
|
At the end, we plot the graph with X vector as X-axis values and Y vector as
Y-axis values.
Example
formula:
|
//
Average daily performance per by day of week
//
One day price change
performance
= perf(close, 1);
//
Day of week
dayofw
= dayofweek();
//
Change day of week numeric values to text format
text
= StringReplace(dayofw
,0,"Sunday");
text
= StringReplace(text,1,"Monday");
text
= StringReplace(text,2,"Tuesday");
text
= StringReplace(text,3,"Wednesday");
text
= StringReplace(text,4,"Thursday");
text
= StringReplace(text,5,"Friday");
//
Plot fixed chart
PLOTFIXED(dayofw, performance,text , iAvg,"Average daily performance per
by day of week",colorGreen,ChartBar,StyleSymbolDiamond);
|
Charts don't contain reference to formula
files but instead contains formula contents.
This means that even if you remove or update a formula file that a chart was
build upon, the chart won't change.
Right click on a chart, and then click on
'Edit formula' to edit a chart formula.
Only the current chart will be affected if you update the formula or change its
name.
You can save the content of this formula to
a file and use it later with other charts.