1. Simulator
The Simulator lets you test strategies or trading systems under historical market conditions to determine whether certain scenarios would have worked well in the past. The idea is that if a trading strategy would have performed well previously, it may be worth considering today. A trading system includes:
Open the 'Simulator' (Analysis->Simulator) · Click on 'New' · Set entries and exits · Set the capital settings · Set stops · Set money management rules · Set symbols that are going to be used in this trading system · Set a ranking system Finally, click on 'Create trading
system'.
Specify the stops to apply to the trading system by clicking on the appropriate icon: · Maximum loss stop: Exit a position if the symbol's performance (points or percent) falls below this level · Profit target stop: Exit a position if the symbol's performance reaches this level · Trailing stop: Exit a position if the symbol's drawdown falls below this level ·
N-bar stop: Exit a position after a specific
number of bars
The Capital settings include:
See Advanced Money Management 1.6. Optimize a trading system
You can optimize a trading system using the
optimizer plug-in or using the simulator optimizer. 1.7. Run or optimize a simulation
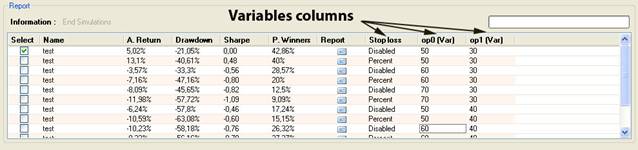
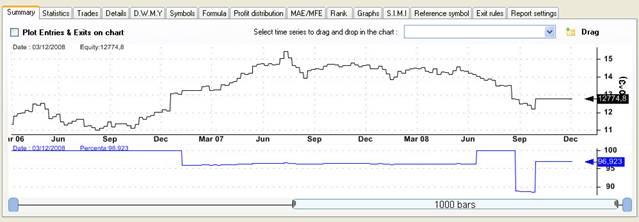
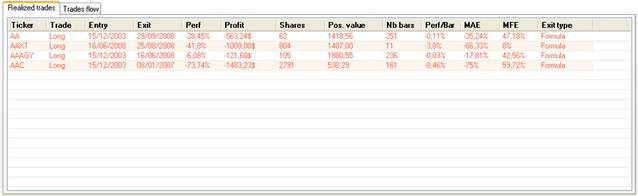
The grid control shows you the simulation
basic statistics.
Right click on
the chart to open a menu.
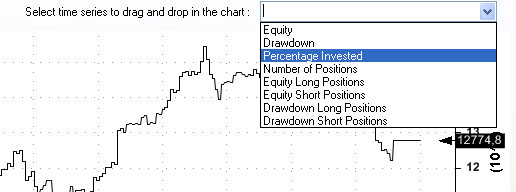
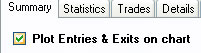
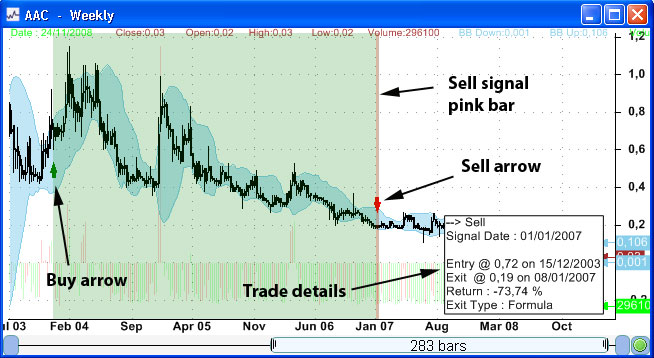
To draw entries and exits signals in a symbol chart, check 'Plot Entries & Exits on chart' then select a symbol that was used in the simulation.
Capital: Initial Capital The size of your account before the simulation started End Capital The size of your account after the simulation ended Net Profit The profit generated by the trading system Net Profit in Percentage The profit generated by the trading system in percentage Exposure The percentage of your account that was invested for all bars Net Risk Adjusted Return Net profit % divided by Exposure % Annual Return Compounded annual return % Risk Adjusted Return - Annual return % divided by Exposure % Average Profit/Loss - (Profit of winners + Loss of losers)/(number of trades) Average Profit/Loss in Percentage - (% Profit of winners + % Loss of losers)/(number of trades) Average Bars Held - sum of bars in trades / number of trades
Total Profit Total profit generated by winning trades Number of Winners The number of winning trades Average Profit - Average profit of the winning trades Average Profit in Percentage Average profit of the winning trades in percentage Average Bars Held For Winners Max Consecutive Winner Largest Winner Number of Bars in Largest Winner
Total Loss Total loss generated by loosing trades Number of Losers The number of loosing trades Average Loss - Average loss of the loosing trades Average Loss in Percentage Average loss of the loosing trades in percentage Average Bars Held For Losers Max Consecutive Loser Largest Loser Number of Bars in Largest Loser
Maximum Trade Drawdown - The largest peak to valley decline experienced in any single trade Maximum Trade Drawdown In percentage - The largest peak to valley decline in percentage experienced in any single trade Maximum system drawdown in dollar - The largest peak to valley decline experienced in portfolio equity Maximum system drawdown in percentage - The largest peak to valley decline in percentage experienced in portfolio equity Recovery factor - Net profit divided by Maximum system drawdown CAR/MaxDD - Compound Annual percentage return divided by Maximum system percentage drawdown RAR/MaxDD - Risk Adjusted Return divided by Maximum system percentage drawdown
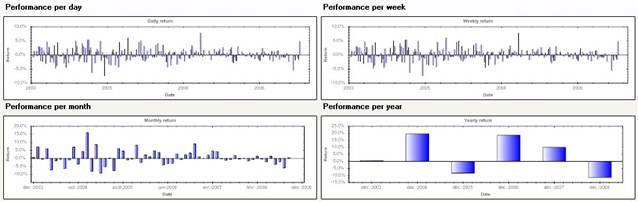
Number of trades The total number of trades generated by the simulation Percent of winners The percentage of trade's winners Annual turnover Example: a value of 100% means that the average holding period of a trade is one year; a value of 200% means that the average holding period of a trade is six months Total trading costs The sum of all the trading costs generated by the simulation Volume activity The sum of all the positions size generated by the simulation Percent trading cost of volume - Total trading costs / Volume activity Percent positive days The percentage of positive days in the simulation equity Percent positive months - The percentage of positive months in the simulation equity Percent positive years The percentage of positive years in the simulation equity Average daily return Average weekly return Average monthly return
Ulcer index - Square root of sum of squared drawdown divided by number of bars Ulcer performance index This indicator is used to measure the riskiness of an investment K Ratio - A ratio that is used in the performance evaluation of an equity relative to its risk. The ratio examines the consistency of equity's return over time. Higher is better Standard deviation - A measure of the dispersion of a set of data from its mean. The more spread apart the data, the higher the deviation. Standard deviation is calculated as the square root of variance. Downside standard deviation - The downside standard deviation from the ordinary standard deviation insofar as the sum is restricted to those returns that are less than the mean Sharpe ratio - The Sharpe ratio tells us whether a portfolio's returns are due to smart investment decisions or a result of excess risk, the higher the better Sortino ratio - The Sortino ratio is similar to the Sharpe ratio, except it uses downside deviation for the denominator instead of standard deviation, the higher the better Profit factor - Profit of winners divided by loss of losers Payoff ratio Ratio of average wins / average loss
Beta - A measure of the volatility, or systematic risk, of a security or a portfolio in comparison to the market as a whole; if a stock's beta is 1.2, it is theoretically 20% more volatile than the market. Alpha - A measure of performance on a risk-adjusted basis, a positive alpha of 1.0 means the fund has outperformed its benchmark index by 1%. Correspondingly, a similar negative alpha would indicate an underperformance of 1%. R Squared The percentage, of a fund or security's movements, that can be explained by movements in a benchmark index. R-squared values range from zero to 100. An R-squared of 100 means that all movements of a security are completely explained by movements in the index Correlation - a statistical measure of how the security and the benchmark move in relation to each other
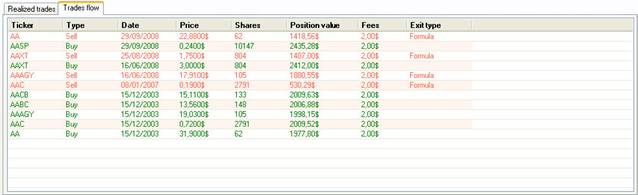
Trades flow: This window shows you the list of all the trade's entries.
1.8.9 Formula
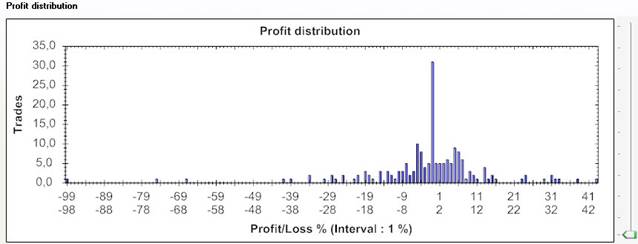
1.8.10 Profit distribution
1.8.13 S.I.M.I
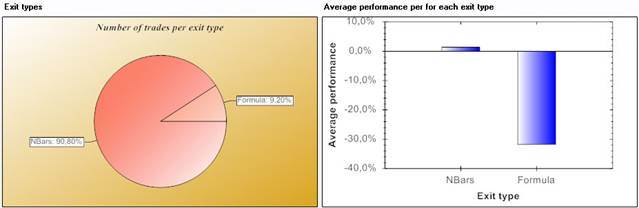
1.8.15 Exit rules
|
|
|
|
|